Hello everyone, I need your help. I am working on an application that calculates sports performance, and I want to generate some statistics. My database contains the following information: Training exercise, training date, training duration, exercise level, and a checkbox indicating whether the exercise was completed or not.
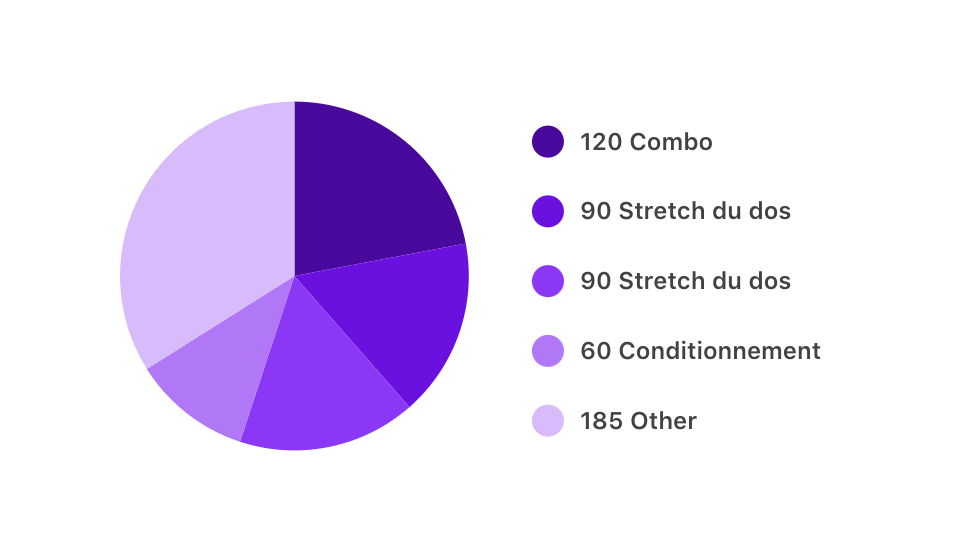
Therefore, over the last 7 rolling days, I would like to have a pie chart showing the distribution of exercises based on the training duration. My problem is that I have tried everything (also custom formula, il ends up summing the totality of all exercises), but it seems that the pie chart does not aggregate my data. For example, if I did two back stretch sessions during the week, the pie chart shows this information twice instead of summing up the total duration I spent on back stretching. Could you please help me?
Here below an example of my pie chart in which you can see 2 slices “Stretch de dos” instead of one
Thanks in advance for your help
Best regards